Total Soluble Neuropilin-1 ELISA
-
Method
Sandwich ELISA, HRP/TMB, 12×8-well detachable strips
-
Sample type
Serum, EDTA plasma, heparin plasma, citrate plasma, urine, cell culture supernatant, and non-human samples
-
Sample volume
10 µl / well
-
Assay time
30 min / 2 h / 1 h / 30 min
-
Sensitivity
0.09 nmol/l (= 6.3 ng/ml)
-
Standard range
0 – 12 nmol/l (= 0 – 836 ng/ml)
-
Conversion factor
1 ng/ml = 0.014 nmol/l (MW: 69.7 kDa)
-
Specificity
Endogenous (natural) and recombinant human soluble Neuropilin-1 (isoform 2 and 3).
-
Precision
In-between (n=10): ≤ 10 % CV
Within-run (n=6): ≤ 11 % CV
-
Cross-reactivity
Neuropilin-1 (NRP-1) only. The amino acid sequence in the respective binding regions of the antibodies show no homology with NRP2. Thus, cross-reactivity to NRP-2 is not expected.
-
Validation Data
See validation data tab for: precision, accuracy, diltuion linearity, values for healthy donors, etc.
Product Overview
The total soluble Neuropilin-1 (NRP1) immunoassay is a 4 hour, 96-well quantitative sandwich enzyme-linked immunosorbent assay (ELISA) for the quantitative determination of free and ligand-bound soluble Neuropilin-1 in human serum and plasma. The assay employs human serum-based standards to ensure the measurement of biologically reliable data.
NRP1 measurements in urine, cell-culture supernatants and non-human samples did not undergo a full validation according to ICH guidelines. However, our performance check suggests that these matrices can be measured with this ELISA. For more information please see our validation data file.
The total soluble Neuropilin-1 ELISA kit uses highly purified, epitope mapped antibodies. The detection antibody used in the total soluble Neuropilin-1 ELISA kit binds to a linear epitope close to the N-terminus in the CUB1 domain of NRP1 and the polyclonal coating antibody recognizes multiple linear epitopes distributed over the entire Neuropilin-1 molecule.
Principle of the Assay
Coating antibody: Polyclonal sheep anti human NRP1
Detection antibody: Monoclonal mouse anti NRP1 antibody, biotin labelled
Antigen: recombinant human Neuropilin-1 protein (AA22-AA644 of Uniprot ID O14786-2, isoform 2)
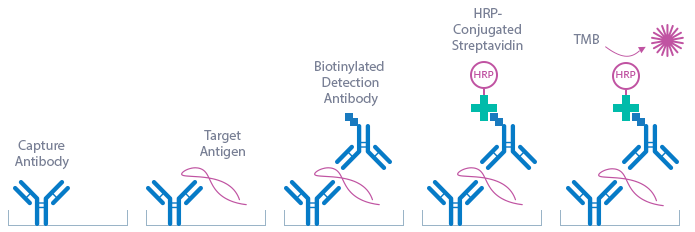
This kit is a sandwich enzyme immunoassay for the direct determination of total soluble Neuropilin-1 in human serum and plasma samples. In a first step, STD/CTRL/Sample require pre-treatment with an equal amount of guanidine hydrochloride (GuHCl) to remove potentially bound ligands, followed by pre-dilution with assay buffer. In a next step, pre-treated and diluted STD/CTRL/Sample and detection antibody (mouse monoclonal anti human Neuropilin-1 IgG) are pipetted into the wells of the microtiter strips, which are pre-coated with anti Neuropilin-1 antibody. Neuropilin-1 present in STD/CTRL/Sample binds to the pre-coated antibody in the well and forms a sandwich with the detection antibody. In the washing step, all non-specific unbound material is removed. Subsequently, the conjugate (Streptavidin-HRPO) is pipetted into the wells and reacts with the detection antibody. After another washing step, the substrate (TMB Tetramethylbenzidine) is pipetted into the wells. The enzyme catalysed colour change of the substrate is directly proportional to the amount of Neuropilin-1. This colour change is detectable with a standard microtiter plate ELISA reader. A dose response curve of the absorbance (optical density, OD at 450 nm) vs. standard concentration is generated, using the values obtained from the standard. The concentration of Neuropilin-1 in the sample is determined directly from the dose response curve.
Typical Standard Curve
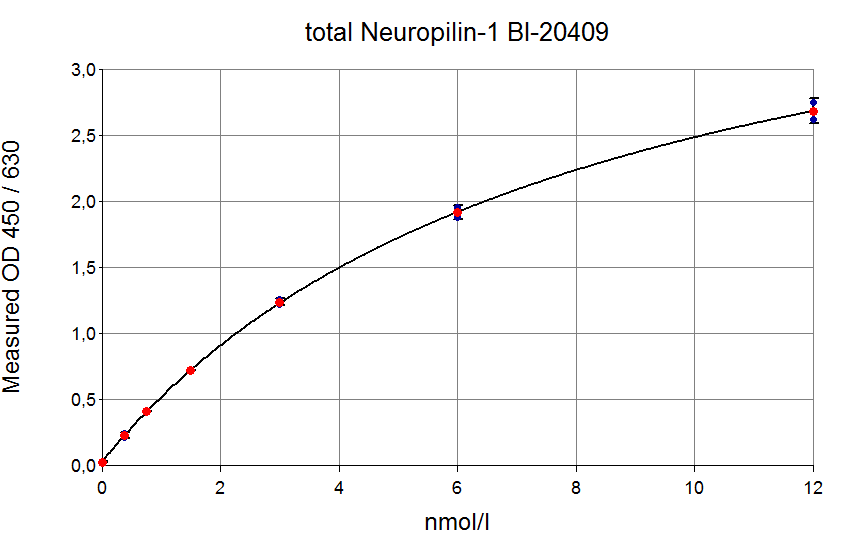
The figure below shows a typical standard curve for the total soluble Neuropilin-1 human ELISA. The immunoassay is calibrated against recombinant soluble Neuropilin-1 peptide:
|
Standard |
Neuropilin-1 [nmol/l] |
O.D. |
|||
|
#1 |
#2 |
Average |
Normalized |
||
|
STD1 |
0 |
0.030 |
0.029 |
0.030 |
- |
|
STD2 |
0.37 |
0.228 |
0.216 |
0.230 |
0.200 |
|
STD3 |
0.75 |
0.380 |
0.411 |
0.401 |
0.371 |
|
STD4 |
1.5 |
0.735 |
0.721 |
0.725 |
0.695 |
|
STD5 |
3 |
1.204 |
1.262 |
1.229 |
1.199 |
|
STD6 |
6 |
1.876 |
1.957 |
1.905 |
1.875 |
|
STD7 |
12 |
2.549 |
2.755 |
2.642 |
2.612 |
Kit Components
|
CONTENT |
DESCRIPTION |
QUANTITY |
|
PLATE |
Polyclonal sheep anti human Neuropilin-1 antibody precoated microtiter strips in strip holder packed in an aluminum bag with desiccant |
12 x 8 tests |
|
DILPLATE |
Uncoated microtiter plate for sample pre-treatment |
12 x 8 wells |
|
WASHBUF |
20x wash buffer concentrate, natural cap |
1 x 50 ml |
|
ASYBUF |
Assay buffer, red cap, ready to use |
1 x 50 ml |
|
STD |
Standards (0; 0.37; 0.75; 1.5; 3; 6; 12 nmol/l), white caps, lyophilized |
7 vials |
|
CTRL |
Controls A+B, yellow caps, lyophilized, exact concentration see labels |
2 vials |
|
AB |
Monoclonal mouse anti human Neuropilin-1 antibody, biotin-labeled, green cap, ready to use |
1 x 6 ml |
|
CONJ |
Conjugate (streptavidin-HRPO), amber cap, ready to use |
1 x 18 ml |
|
GuHCl |
Guanidine Hydrochloride (GuHCl), clear cap, ready to use |
1 x 1.5 ml |
|
SUB |
Substrate (TMB solution), blue cap, ready to use |
1 x 22 ml |
|
STOP |
STOP solution, white cap, ready to use |
1 x 7 ml |
Storage instructions:All reagents of the human soluble Neuropilin-1 ELISA kit are stable at 4°C until the expiry date stated on the label of each reagent.
Serum, EDTA plasma, heparin plasma, citrate plasma, cell culture supernatant, urine, non-human samples are suitable for use in this assay. Do not change sample type during studies. We recommend duplicate measurements for all samples, standards and controls. The listed sample collection and storage conditions listed are intended as general guidelines.
Serum & Plasma
Collect venous blood samples in standardized serum separator tubes (SST) or standardized blood collection tubes using EDTA, heparin or citrate as an anticoagulant. For serum samples, allow samples to clot for 30 minutes at room temperature. Perform separation by centrifugation according to the tube manufacturer’s instructions for use. Assay the acquired samples immediately or aliquot and store at -25°C or lower. Lipemic or haemolysed samples may give erroneous results. Do not freeze-thaw samples more than five times.
Urine
Note: the experiments performed to measure Neuropilin-1 in urine samples did not undergo a full validation according to ICH guidelines. However, our performance check suggests that urine samples can be measured with this ELISA. For more information please see our validation data tab.
Aseptically collect the first urine of the day (mid-stream), voided directly into a sterile container. Centrifuge to remove particulate matter, assay immediately or aliquot and store at -25°C or lower.
Non-Human Samples
Note: the experiments performed to measure Neuropilin-1 in non-human samples did not undergo a full validation according to ICH guidelines. However, our performance check suggests that non-human samples can be measured with this ELISA. For more information please see our validation data tab.
Cell Culture Supernatant
Note: the experiments performed to measure Neuropilin-1 cell culture supernatants did not undergo a full validation according to ICH guidelines. However, our performance check suggests that cell culture supernatants can be measured with this ELISA. For more information please see our validation data file.
Remove particulates by centrifugation and assay immediately or aliquot and store samples at
-25°C or lower. Do not freeze-thaw samples more than five times.
Reagent Preparation
Wash Buffer
|
1. |
Bring the WASHBUF concentrate to room temperature. Crystals in the buffer concentrate will dissolve at room temperature. |
|
2. |
Dilute the WASHBUF concentrate 1:20, e.g. 50 ml WASHBUF + 950 ml distilled or deionized water. Only use diluted WASHBUF when performing the assay. |
The diluted WASHBUF is stable up to one month at 4°C (2-8°C).
Standards for Serum, Plasma, Urine and Non-Human Sample Measurements
|
1. |
Pipette 200 µl of distilled or deionized water into each standard (STDs) and control (CTRL) vial. The exact concentration is printed on the label of each vial. |
|
2. |
Leave at room temperature (18-26°C) for 15 min. Mix gently. |
Reconstituted STDs and CTRLs are stable at -25°C or lower until expiry date stated on the label. STDs and CTRLs are stable for five freeze-thaw cycles.
Standards for Cell Culture Supernatant Measurements
For the preparation of a cell culture-based standard curve always use the identical cell culture medium (CCM) as used for the experiment.
|
1. |
Reconstitute standard 7 (STD7) in 200 µl deionized water. Leave at room temperature (18-26°C) for 15 min and mix well before making dilutions. Use polypropylene tubes. |
|
2. |
Mark tubes ccSTD6 to ccSTD1. Dispense 100 µl cell culture medium into each vial. |
|
3. |
Pipette 100 µl of STD7 into tube marked as ccSTD6. Mix thoroughly. |
|
4. |
Transfer 100 µl of ccSTD6 into the tube marked as ccSTD5. Mix thoroughly. |
|
5. |
Continue in the same fashion to obtain ccSTD4 to standard 2. CCM serves as the ccSTD1 (0 nmol/l soluble Neuropilin-1). |
|
6. |
Using the prepared standards, follow the protocol as indicated for serum, plasma and urine samples. |
Attention: Supplied STD1-STD7 and controls are only valid for serum, plasma and urine and should not be used for cell culture measurements.
Sample Preparation
Bring samples to room temperature and mix samples gently to ensure the samples are homogenous. We recommend duplicate measurements for all samples. Samples with analyte concentrations outside of the calibration range of the assay (STD7; 12 nmol/l NRP1) should be diluted with STD1 (Standard 1= human serum containging 0 nmol/l NRP1) before pre-treatment with GuHCl.
Assay Protocol
Read the entire protocol before beginning the assay.
In the Pre-Dilution Plate
|
1. |
Pipette 10 µl STD/CTRL/SAMPLE (Standard/Control/Samples) into the respective wells. |
|
2. |
Add 10 µl GuHCl (Guanidin Hydrochloride, clear cap) into each well. Take care to add the GuHCl to the STD/CTRL/SAMPLE at the bottom of the well. |
|
3. |
Cover the plate tightly, swirl gently and incubate for 30 minutes at room temperature. |
|
4. |
Add 200 µl ASYBUF (assay buffer, red cap) into each well. Cover plate and swirl gently. |
In the Pre-Coated Plate
|
5. |
Take microtiter strips out of the aluminum bag. Store unused strips with desiccant at 4°C in the aluminum bag. Strips are stable until expiry date stated on the label. |
|
6. |
Pipette 50 µl ASYBUF into each well. |
|
7. |
Transfer 50 µl pre-treated STD/CTRL/SAMPLE from pre-dilution plate into the respective wells. Swirl gently. If available, use a multichannel pipette for the transfer. |
|
8. |
Add 50 µl AB (biotinylated anti NRP-1 antibody, green cap) into each well. Swirl gently. |
|
9. |
Cover the plate tightly, swirl gently and incubate for 2 hours at room temperature (18-26°C). |
|
10. |
Aspirate and wash wells 5x with 300 µl diluted WASHBUF. After the final wash, remove the remaining WASHBUF by strongly tapping plate against a paper towel. |
|
11. |
Add 150 µl CONJ (conjugate, amber cap) into each well. Swirl gently. |
|
12. |
Cover tightly and incubate for 1 hour at room temperature 18-26°C), in the dark. |
|
13. |
Aspirate and wash wells 5x with 300 µl diluted WASHBUF. After the final wash, remove remaining WASHBUF by strongly tapping plate against a paper towel. |
|
14. |
Add 150 µl SUB (substrate, blue cap) into each well. Swirl gently. |
|
15. |
Incubate for 30 min at room temperature in the dark. |
|
16. |
Add 50 µl STOP (stop solution, white cap) into each well, swirl gently. |
|
17. |
Measure absorbance immediately at 450 nm with reference 630 nm, if available. |
Calculation of Results
Read the optical density (OD) of all wells on a plate reader using 450 nm wavelength (reference wavelength 630 nm). Construct a standard curve from the absorbance read-outs of the standards using commercially available software capable of generating a four-parameter logistic (4-PL) fit. Alternatively, plot the standards’ concentration on the x-axis against the mean absorbance for each standard on the y-axis and draw a best fit curve through the points on the graph. Curve fitting algorithms other than 4-PL have not been validated and will need to be evaluated by the user.
Obtain sample concentrations from the standard curve. If required, nmol/l can be converted into pg/ml by applying a conversion factor (1 nmol/l = 0.014 ng/ml; Neuropilin-1 MW: 69.7 kDa). )). Respective dilution factors have to be considered when calculating the final concentration of the sample.
The quality control protocol supplied with the kit shows the results of the final release QC for each kit at the production date. ODs obtained by customers may differ due to various influences including a normal decrease of signal intensity throughout shelf life. However, this does not affect the validity of the results provided an OD of 1.00 or higher is obtained for the standard with the highest concentration, and the measured values of the CRTLS fall within their target ranges (see labels).
-
Cardiology
-
Myocardial infarction (Wen et al., 2018)
-
-
Oncology
-
Breast cancer (Arpel et al., 2016; Han et al., 2015; Hellec et al., 2018)
-
Hepatocellular carcinoma (Lin et al., 2018; Zhang et al., 2016; Zhuang et al., 2014)
-
Glioblastoma (Kwiatkowski et al., 2017; Zhang et al., 2018, p. 1)
-
Cholangiocarcinoma (Zhu et al., 2018)
-
Adenocarcinoma (Ben et al., 2014; Matkar et al., 2016)
-
Gastric cancer (Li et al., 2016)
-
Non-small lung cancer (Dong et al., 2015)
-
Melanoma (Lu et al., 2015)
-
Ovarian carcinoma (Jiang et al., 2015)
-
Oral squamous cell carcinoma (Chu et al., 2014)
-
Osteosarcoma (Yue et al., 2014; Zhu et al., 2014)
-
Acute myeloid leukemia (Zhao et al., 2014)
-
Bladder cancer (Cheng et al., 2014)
-
Squamous cell carcinoma (Alattar et al., 2014b)
-
Colorectal cancer (Zhang et al., 2012)
-
Nasopharyngeal carcinoma (Xu et al., 2013)
-
-
Other
-
Menstrual migraine (Pollock et al., 2018)
-
Preeclampsia (Arad et al., 2017)
-
Endometriosis (Yerlikaya et al., 2016)
-
Obesity (Wilson et al., 2018)
-
All Biomedica ELISAs are validated according to international FDA/ICH/EMEA guidelines. For more information about our validation guidelines, please refer to our quality (->link) page and published validation guidelines and literature.
1. ICH Q2(R1) Validation of Analytical Procedures: Text and Methodology
2. EMEA/CHMP/EWP/192217/2009 Guideline on bioanalytical method validation
3. Bioanalytical Method Validation, Guidance for Industry, FDA, May 2018
Calibration
The total soluble Neuropilin-1 human immunoassay is calibrated against recombinant human soluble Neuropilin-1 protein (AA22-AA644 of O14786-2 (Uniprot ID)).
Detection Limit & Sensitivity
To determine the sensitivity of the human total soluble Neuropilin-1 ELISA, experiments measuring the Lower Limit of Detection (LOD) and the lower limit of quantification (LLOQ) were conducted.
The LOD, also called the detection limit, is the lowest point at which a signal can be distinguished above the background signal, i.e. the signal that is measured in the absence of Neuropilin-1, with a confidence level of 99%. It is defined as the mean back calculated concentration of standard 1 (STD1) Neuropilin-1-free sample (three independent measurements) plus three times the standard deviation of the measurements.
The LLOQ, or sensitivity of an assay, is the lowest concentration at which an analyte can be accurately quantified. The criteria for accurate quantification at the LLOQ are an analyte recovery between 75 and 125% and a coefficient of variation (CV) of less than 25%. The lowest concentration of Neuropilin-1, which meets both criteria, is reported as the LLOQ.
The following values were determined for the total soluble Neuropilin-1 human ELISA:
|
LOD |
0.09 nmol/l |
|
LLOQ |
0.09 nmol/l |
Precision
The precision of an ELISA is defined as its ability to measure the same concentration consistently within the same experiments carried out by one operator (within-run precision or repeatability) and across several experiments using the same samples but conducted by several operators at different locations using different ELISA lots (in-between-run precision or reproducibility).
Within-Run Precision
Within-run/intra assay precision was assessed by measuring two samples of known concentration six times within one NRP1 ELISA lot by one operator.
|
ID |
n |
Mean NRP1 [pmol/l] |
SD [pmol/l] |
CV (%) |
|
S1 |
6 |
0.8 |
0.1 |
11 |
|
S2 |
6 |
6.2 |
0.4 |
7 |
In-Between-Run Precision
In-between-run/intra-assay precision was assessed by measuring two samples twelve times within two NRP1 ELISA kit lots on three days by three different operators.
|
ID |
n |
Mean NRP1 [pmol/l] |
SD [pmol/l] |
CV (%) |
|
S1 |
12 |
0.8 |
0.08 |
10 |
|
S2 |
12 |
6.2 |
0.36 |
6 |
Accuracy
The accuracy of an ELISA is defined as the precision with which it can recover samples of known concentrations.
The recovery of the total soluble Neuropilin-1 ELISA was measured by adding recombinant soluble Neuropilin-1 to human samples containing a known concentration endogenous soluble Neuropilin-1. The % recovery of the spiked concentration was calculated as the percentage of measured compared over the expected value.
This table shows the summary of the recovery experiments in the soluble Neuropilin-1 ELISA in different sample matrices:
|
|
% Recovery |
||||
|
Sample Matrix |
n |
+ 1.5 nmol/l, sNRP1 |
+ 6 nmol/l, sNRP1 |
||
|
Mean |
Range |
Mean |
Range |
||
|
Serum |
6 |
90 |
75 - 113 |
92 |
81 - 109 |
|
EDTA plasma |
6 |
91 |
88 - 107 |
93 |
82 - 109 |
|
Citrate plasma |
1 |
98 |
|
108 |
|
|
Heparin plasma |
1 |
115 |
|
97 |
|
Data showing recovery of soluble Neuropilin-1 in human serum samples:
|
Soluble neuropilin-1 [nmol/l] |
% Recovery |
|||||
|
Sample Matrix |
ID |
Reference |
+ 1.5 nmol/l |
+ 6 nmol/l |
+ 1.5 nmol/l |
+ 6 nmol/l |
|
Serum |
s1 |
1.5 |
2.1 |
6.1 |
91 |
90 |
|
Serum |
s2 |
2.0 |
2.4 |
6.8 |
94 |
97 |
|
Serum |
s3 |
2.6 |
3.0 |
7.8 |
113 |
109 |
|
Serum |
s4 |
1.6 |
2.1 |
6.3 |
85 |
92 |
|
Serum |
s5 |
1.8 |
2.2 |
5.8 |
84 |
81 |
|
Serum |
s6 |
2.6 |
2.4 |
6.3 |
75 |
84 |
|
Mean |
90 |
92 |
||||
|
Min |
75 |
81 |
||||
|
Max |
113 |
109 |
||||
Data showing recovery of soluble Neuropilin-1 in human EDTA plasma samples:
|
Soluble neuropilin-1 [nmol/l] |
% Recovery |
|||||
|
Sample Matrix |
ID |
Reference |
+ 1.5 nmol/l |
+ 6 nmol/l |
+ 1.5 nmol/l |
+ 6 nmol/l |
|
EDTA plasma |
e1 |
1.4 |
2.1 |
6.6 |
93 |
98 |
|
EDTA plasma |
e2 |
1.8 |
2.4 |
7.1 |
98 |
103 |
|
EDTA plasma |
e3 |
2.1 |
2.6 |
7.6 |
107 |
109 |
|
EDTA plasma |
e4 |
1.5 |
2.2 |
5.7 |
95 |
82 |
|
EDTA plasma |
e5 |
1.6 |
2.1 |
5.7 |
90 |
83 |
|
EDTA plasma |
e6 |
2.2 |
2.4 |
6.2 |
88 |
85 |
|
Mean |
95 |
93 |
||||
|
Min |
88 |
82 |
||||
|
Max |
107 |
109 |
||||
Data showing recovery of soluble Neuropilin-1 in human heparin plasma samples:
|
Soluble neuropilin-1 [nmol/l] |
% Recovery |
|||||
|
Sample Matrix |
ID |
Reference |
+ 1.5 nmol/l |
+ 6 nmol/l |
+ 1.5 nmol/l |
+ 6 nmol/l |
|
Heparin plasma |
h1 |
2.2 |
2.8 |
6.9 |
115 |
97 |
Data showing recovery of soluble Neuropilin-1 in human citrate plasma samples:
|
Soluble neuropilin-1 [nmol/l] |
% Recovery |
|||||
|
Sample Matrix |
ID |
Reference |
+ 1.5 nmol/l |
+ 6 nmol/l |
+ 1.5 nmol/l |
+ 6 nmol/l |
|
Citrate plasma |
c1 |
1.9 |
2.4 |
7.4 |
98 |
108 |
Dilution Linearity & Parallelism
Tests of dilution linearity and parallelism ensure that both endogenous and recombinant samples containing soluble Neuropilin-1 behave in a dose dependent manner and are not affected by matrix effects. Dilution linearity assesses the accuracy of measurements in diluted human samples spiked with known concentrations of recombinant analyte. By contrast, parallelism refers to dilution linearity in human samples and provides evidence that the endogenous analyte behaves the same way as the recombinant one. Dilution linearity and parallelism are assessed for each sample type and are considered acceptable if the results are within ± 20% of the expected concentration.
Dilution linearity was assessed by serially diluting human samples spiked with 6 nmol/l recombinant human soluble Neuropilin-1 with STD1 (Standard 1= human serum containing 0 nmol/l Neuropilin-1).
The table below shows the mean recovery and range of serially diluted recombinant soluble Neuropilin-1 in serum and plasma.
|
|
|
|
% Recovery of recombinant soluble Neuropilin-1 in diluted samples |
|||||
|
Sample Matrix |
n |
1+1 |
1+3 |
1+7 |
||||
|
Mean |
Range |
Mean |
Range |
Mean |
Range |
|||
|
Serum |
3 |
95 |
79 - 108 |
98 |
90 - 102 |
99 |
90 - 110 |
|
|
EDTA plasma |
3 |
84 |
79 - 87 |
96 |
89 - 101 |
94 |
89 - 101 |
|
|
Citrate plasma |
1 |
77 |
|
90 |
88 |
|||
|
Heparin plasma |
1 |
95 |
|
104 |
104 |
|||
Data showing dilution linearity of recombinant soluble Neuropilin-1 in human serum samples:
|
Soluble Neuropilin-1 [nmol/l] |
% Recovery |
|||||||
|
Sample matrix |
ID |
Reference |
1+1 |
1+3 |
1+7 |
1+1 |
1+3 |
1+7 |
|
Serum |
s1 |
6.1 |
3.3 |
1.6 |
0.8 |
108 |
102 |
110 |
|
Serum |
s2 |
6.8 |
3.4 |
1.6 |
0.8 |
99 |
92 |
90 |
|
Serum |
s3 |
7.8 |
3.1 |
2.0 |
0.9 |
79 |
100 |
97 |
|
|
Mean |
95 |
98 |
99 |
||||
|
|
Min |
79 |
92 |
90 |
||||
|
|
Max |
108 |
102 |
110 |
||||
Data showing dilution linearity of recombinant soluble Neuropilin-1 in human EDTA plasma samples:
|
Soluble Neuropilin-1 [nmol/l] |
% Recovery |
|||||||
|
Sample matrix |
ID |
Reference |
1+1 |
1+3 |
1+7 |
1+1 |
1+3 |
1+7 |
|
EDTA plasma |
e1 |
6.6 |
2.9 |
1.7 |
0.8 |
87 |
101 |
101 |
|
EDTA plasma |
e2 |
7.1 |
3.1 |
1.7 |
0.8 |
86 |
96 |
89 |
|
EDTA plasma |
e3 |
7.6 |
3.0 |
1.7 |
0.9 |
79 |
92 |
91 |
|
|
Mean |
84 |
96 |
94 |
||||
|
|
Min |
79 |
92 |
89 |
||||
|
|
Max |
87 |
101 |
101 |
||||
Data showing dilution linearity of recombinant soluble Neuropilin-1 in human heparin plasma samples:
|
Soluble Neuropilin-1 [nmol/l] |
% Recovery |
||||||||
|
Sample matrix |
ID |
Reference |
1+1 |
1+3 |
1+7 |
1+1 |
1+3 |
1+7 |
|
|
Heparin plasma |
h1 |
6.9 |
3.3 |
1.8 |
0.9 |
95 |
104 |
104 |
|
Data showing dilution linearity of recombinant soluble Neuropilin-1 in human citrate plasma samples:
|
Soluble Neuropilin-1 [nmol/l] |
% Recovery |
||||||||
|
Sample matrix |
ID |
Reference |
1+1 |
1+3 |
1+7 |
1+1 |
1+3 |
1+7 |
|
|
Citrate plasma |
c1 |
7.4 |
2.9 |
1.7 |
0.8 |
77 |
90 |
88 |
|
Parallelism was assessed by serially diluting samples containing endogenous Neuropilin-1 with STD1 (Standard 1=, human serum containing 0 nmol/l Neuropilin-1).
The table below shows the mean recovery and range of serially diluted endogenous (natural) soluble Neuropilin-1 in several human sample matrices:
|
|
|
|
% Recovery of endogenous Neuropilin-1 in diluted samples |
|||||
|
Sample Matrix |
n |
1+1 |
1+3 |
1+7 |
||||
|
Mean |
Range |
Mean |
Range |
Mean |
Range |
|||
|
Serum |
6 |
95 |
80-122 |
104 |
90-129 |
114 |
99-148 |
|
|
EDTA plasma |
6 |
107 |
98-117 |
110 |
97-127 |
115 |
105-137 |
|
|
Citrate plasma |
1 |
101 |
102 |
111 |
||||
|
Heparin plasma |
1 |
99 |
104 |
110 |
||||
Data showing dilution linearity of endogenous soluble Neuropilin-1 in human serum samples:
|
Soluble Neuropilin-1 [nmol/l] |
% Recovery |
|||||||
|
Sample matrix |
ID |
Reference |
1+1 |
1+3 |
1+7 |
1+1 |
1+3 |
1+7 |
|
Serum |
s1 |
2.7 |
1.6 |
0.9 |
0.5 |
122 |
129 |
148 |
|
Serum |
s2 |
5.1 |
2.7 |
1.5 |
0.8 |
107 |
115 |
123 |
|
Serum |
s3 |
4.5 |
1.8 |
1.1 |
0.6 |
80 |
95 |
99 |
|
Serum |
s4 |
5.0 |
2.4 |
1.3 |
0.7 |
95 |
99 |
107 |
|
Serum |
s5 |
5.4 |
2.2 |
1.2 |
0.7 |
82 |
90 |
104 |
|
Serum |
s6 |
4.0 |
1.7 |
1.0 |
0.5 |
86 |
97 |
104 |
|
|
Mean |
95 |
104 |
114 |
||||
|
|
Min |
80 |
90 |
99 |
||||
|
|
Max |
122 |
129 |
148 |
||||
Data showing dilution linearity of endogenous soluble Neuropilin-1 in human EDTA plasma samples:
|
Soluble Neuropilin-1 [nmol/l] |
% Recovery |
|||||||
|
Sample matrix |
ID |
Reference |
1+1 |
1+3 |
1+7 |
1+1 |
1+3 |
1+7 |
|
EDTA plasma |
e1 |
2.8 |
1.6 |
0.9 |
0.5 |
117 |
127 |
137 |
|
EDTA plasma |
e2 |
2.7 |
1.3 |
0.7 |
0.4 |
98 |
105 |
106 |
|
EDTA plasma |
e3 |
3.4 |
1.9 |
0.9 |
0.5 |
110 |
111 |
114 |
|
EDTA plasma |
e4 |
3.2 |
1.7 |
0.9 |
0.4 |
108 |
114 |
111 |
|
EDTA plasma |
e5 |
3.3 |
1.8 |
0.9 |
0.5 |
111 |
107 |
117 |
|
EDTA plasma |
e6 |
3.9 |
2.0 |
0.9 |
0.5 |
101 |
97 |
105 |
|
|
Mean |
107 |
110 |
115 |
||||
|
|
Min |
98 |
97 |
105 |
||||
|
|
Max |
117 |
127 |
137 |
||||
Data showing dilution linearity of endogenous soluble Neuropilin-1 in human heparin plasma samples:
|
Soluble Neuropilin-1 [nmol/l] |
% Recovery |
|||||||
|
Sample matrix |
ID |
Reference |
1+1 |
1+3 |
1+7 |
1+1 |
1+3 |
1+7 |
|
Heparin plasma |
h1 |
3.1 |
1.5 |
0.8 |
0.4 |
99 |
104 |
110 |
Data showing dilution linearity of endogenous soluble Neuropilin-1 in human citrate plasma samples:
|
Soluble Neuropilin-1 [nmol/l] |
% Recovery |
||||||||
|
Sample matrix |
ID |
Reference |
1+1 |
1+3 |
1+7 |
1+1 |
1+3 |
1+7 |
|
|
Citrate plasma |
c1 |
2.7 |
1.4 |
0.7 |
0.4 |
101 |
102 |
111 |
|
Characterization of the Antibodies
The total soluble Neuropilin-1 ELISA utilizes a monoclonal anti-human Neuropilin-1 antibody that binds to a linear epitope close to the N-terminus in the CUB 1 domain of the Neuropilin-1 molecule. The polyclonal detection antibody binds to multiple linear epitopes, distributed over the entire Neuropilin-1 molecule.
Detection Antibody: Monoclonal mouse anti-Neuropilin-1 antibody-HRP binds to a linear epitope close to the N-terminus in the CUB 1 domain of the Neuropilin-1 molecule.
Coating Antibody: Polyclonal sheep anti-human Neuropilin-1 antibody binding to multiple linear epitopes distributed over the entire Neuropilin-1 molecule (between AA81-AA630).
Specificity
The specificity of an ELISA is defined as its ability to exclusively recognize the analyte of interest.
The specificity of the total soluble Neuropilin-1 ELISA was shown by characterizing both the capture and the detection antibodies through epitope mapping and affinity measurements. In addition, the specificity of the ELISA was established through competition experiments, which measure the ability of the antibodies to exclusively bind Neuropilin-1.
The assay is optimized to detect soluble total Neuropilin-1 (NRP1) in human plasma and serum.
This assay recognizes endogenous and recombinant human soluble Neuropilin-1 (isoform 2 and 3).
The human sequence homology between NRP1 and NRP2 is low. The amino acid sequence in the respective binding regions of the antibodies show no homology with NRP2. Thus a cross reactivity to NRP2 is not expected.
Competition of Signal
Competition experiments were carried out by pre-incubating human samples with an excess of coating antibody. The concentration measured in this mixture was then compared to a reference value, which was obtained from the same sample but without the pre-incubation step.
The table below shows the competition of endogenous concentrations in serum and plasma samples:
| Neuropilin-1 [nmol/l] | %Competition | |||
| Sample matrix | ID | Reference | Reference+ antibody | |
| Serum | s1 | 1.5 | 0.2 | 84 |
| Serum | s2 | 2.0 | 0.0 | 100 |
| Serum | s3 | 2.6 | 0.0 | 100 |
| EDTA plasma | e1 | 1.4 | 0.0 | 100 |
| EDTA plasma | e2 | 1.8 | 0.0 | 100 |
| EDTA plasma | e3 | 2.1 | 0.0 | 100 |
| Citrate plasma | c1 | 1.9 | 0.0 | 100 |
| Heparin plasma | h1 | 2.2 | 0.0 | 100 |
| Mean | 100 | |||
Isoforms
Isoform 1 is not soluble in blood.
Isoforms 2 (longer) and 3 (shorter, C-terminal domain missing), which are generated by alternative splicing, are both soluble and detected by this assay. The linear epitopes of the coating and the detection antibodies were analyzed by epitope mapping.
Cross-Reactivity
The human sequence homology between Neuropilin-1 and Neuropilin-2 is low. The amino acid sequence in the respective binding regions of the antibodies shows no homology with Neuropilin-2. Therefore, cross-reactivity to Neuropilin-2 is not expected.
The sequence of Neuropilin-1 (NRP-1) in mammals is highly conserved.
The listed species below show a homology of >90% with human Neuropilin-1:
- Macacamulatta (Rhesus macaque)
- Pan paniscus (Pygmy chimpanzee) (Bonobo)
- Pongo abelii (Sumatran orangutan) (Pongo pygmaeusabelii)
- Susscrofa (Pig)
- Chlorocebussabaeus (Green monkey) (Cercopithecus sabaeus)
- Aotusnancymaae (Ma's night monkey)
- Gorilla gorillagorilla (Western lowland gorilla)
- Neovison vison (American mink) (Mustela vison)
- Callithrix jacchus (White-tufted-ear marmoset)
Sample Stability
Sample preparation
We recommend separating plasma or serum by centrifugation as soon as possible, e.g. 20 min at 2,000 x g, preferably at 4°C (2-8°C). Samples can be stored at 4°C (2-8°C) overnight. For long term storage, aliquot the acquired plasma or serum samples and store at -25°C or lower.
Freeze-thaw stability
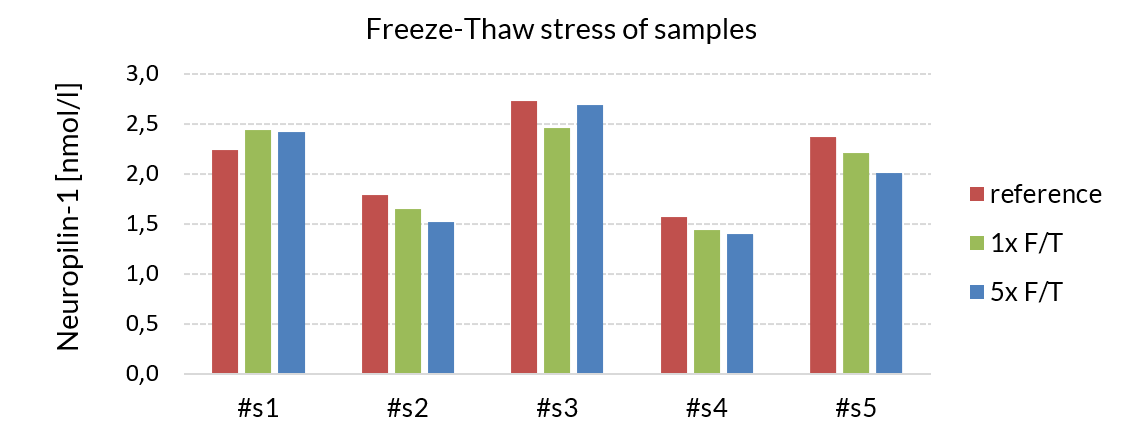
The stability of endogenous soluble Neuropilin-1 was tested by comparing soluble Neuropilin-1 measurements in samples that had undergone five freeze-thaw cycles. The mean recovery of sample concentration after five freeze-thaw cycles is 93%.
| Sample ID | Soluble neuropilin -1 [nmol/l] | % Recovery | ||
| Reference | 1x | 5x | ||
| #s1 | 2.2 | 2.4 | 2.4 | 108 |
| #s2 | 1.8 | 1.7 | 1.5 | 85 |
| #s3 | 2.7 | 2.5 | 2.7 | 99 |
| #s4 | 1.6 | 1.4 | 1.4 | 89 |
| #s5 | 2.4 | 2.2 | 2.0 | 85 |
| Mean | 93 | |||
Samples can be subjected to 5 freeze-thaw cycles.
Sample Values
Serum and Plasma Soluble Neuropilin-1 Values in Apparently Healthy Donors
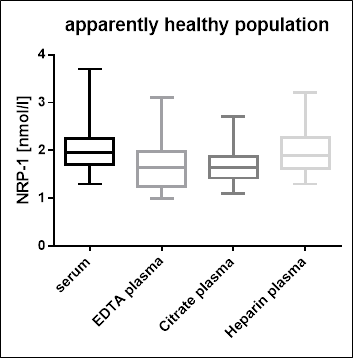
Total soluble Neuropilin-1 reference ranges were established using twenty-four serum and plasma samples from apparently healthy donors. No medical histories were available for the volunteers.
|
Sample Matrix |
n |
Median Neurpilin-1 [nmol/l] |
Range [nmol/l] |
|
Serum |
24 |
2.0 |
1.3 - 3.7 |
|
EDTA plasma |
24 |
1.7 |
1.0 - 3.1 |
|
Heparin plasma |
24 |
1.9 |
1.1 - 2.7 |
|
Citrate plasma |
24 |
1.7 |
1.3 - 3.2 |
We recommended establishing the normal range for each laboratory.
Soluble Neuropilin-1 Values in Chronic Kidney Disease and Dialysis Patients
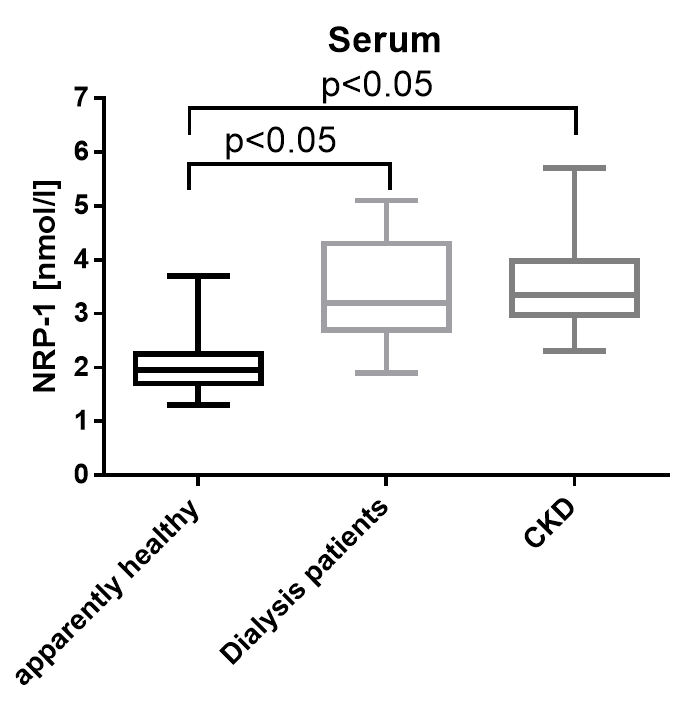
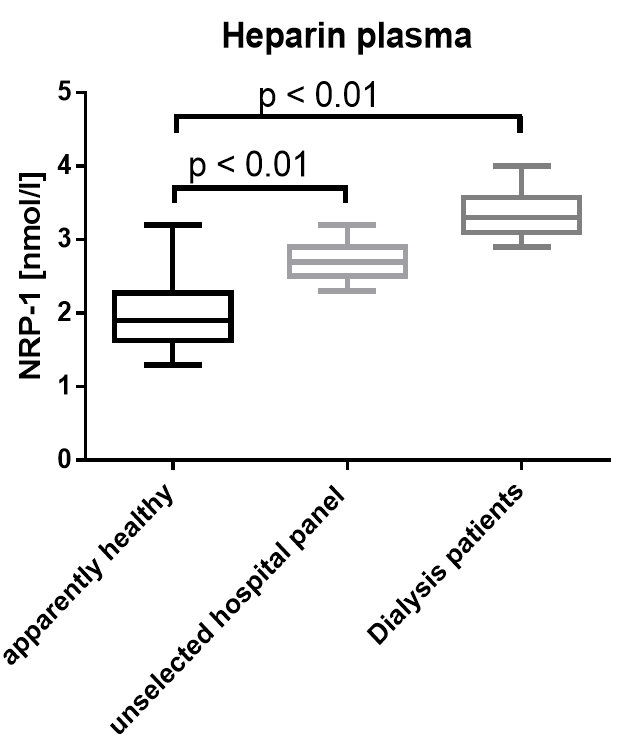
Soluble Neuropilin-1 was measured in serum and heparin plasma samples of apparently healthy donors and chronic kidney disease (CKD) and dialysis patients and patients in an unselected hospital panel. Soluble Neuropilin-1 is significantly increased in all patient cohorts.
|
Cohort |
Sample Matrix |
n |
Median Neuropilin-1 [nmol/l] |
Range [nmol/l] |
|
Apparently Healthy |
Serum |
24 |
2.0 |
1.3 - 3.7 |
|
Dialysis Patients |
Serum |
15 |
3.2 |
1.9 - 5.1 |
|
CKD |
Serum |
22 |
3.4 |
2.3 - 5.7 |
|
Apparently Healthy |
Heparin plasma |
24 |
1.9 |
1.3 - 3.2 |
|
Unselected hospital panel |
Heparin plasma |
8 |
2.7 |
2.3 – 3.2 |
|
Dialysis Patients |
Heparin plasma |
16 |
3.3 |
2.9 - 4 |
Graph showing a comparison of NRP1 values in apparently healthy donors and dialysis and CKD patients:
Graph showing a comparison of NRP1 values in apparently healthy donors, an unselected hospital panel and dialysis patients:
Matrix Comparison
Comparison of Neuropilin-1 Serum and Plasma Sample Values from Apparently Healthy Individuals
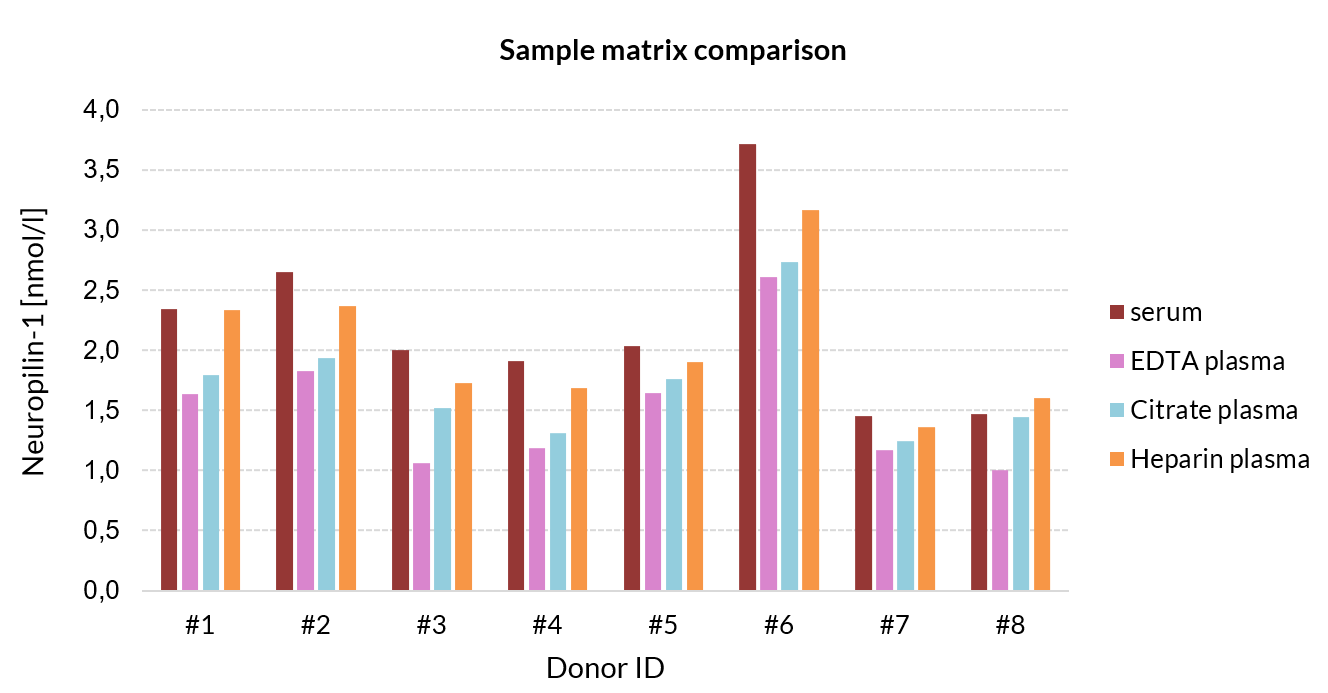
Eight samples of apparently healthy individuals were prepared, each sample derived from one donor. Samples were assayed, and the concentrations of the samples were compared.
|
|
Solube Neuropilin-1 [nmol/l] | %CV | ||||
| Donor ID | Serum | EDTA plasma | Citrate plasma | Heparin plasma | All matrices | Plasma only |
| #1 | 2.3 | 1.6 | 1.8 | 2.3 | 16 | 16 |
| #2 | 2.6 | 1.8 | 1.9 | 2.4 | 15 | 11 |
| #3 | 2.0 | 1.1 | 1.5 | 1.7 | 22 | 19 |
| #4 | 1.9 | 1.2 | 1.3 | 1.7 | 19 | 15 |
| #5 | 2.0 | 1.6 | 1.8 | 1.9 | 8 | 6 |
| #6 | 3.7 | 2.6 | 2.7 | 3.2 | 14 | 8 |
| #7 | 1.5 | 1.2 | 1.2 | 1.4 | 8 | 6 |
| #8 | 1.5 | 1.0 | 1.4 | 1.6 | 16 | 19 |
| Mean | 15 | 13 | ||||
Figure showing matrix comparison of soluble Neuropilin-1 sample concentrations between serum, EDTA-plasma, heparin plasma, and citrate plasma in an apparently healthy cohort (n=8).
 Download biomedica product list 2018


